By: Michael T. Kuczynski, Nathan Neeteson, 2023
License: CC-BY
How to cite: Cite the ORMIR_XCT publication: Kuczynski et al., (2024). ORMIR_XCT: A Python package for high resolution peripheral quantitative computed tomography image processing. Journal of Open Source Software, 9(97), 6084, Kuczynski et al. (2024)
Aims
Investigate the local thickness of structures in Python using the ORMIR_XCT package.
Table of contents
Step 1: Imports
Step 2: Generating Shapes
Step 3: Check Estimated Thickness
Step 1: Imports:
import numpy as np
import SimpleITK as sitk

from matplotlib import pyplot as plt
from ormir_xct.core.util.hildebrand_thickness import calc_structure_thickness_statistics
Step 2: Synthetic shape mask functions:
def create_shape(shape, voxel_widths, thickness, shape_type="sphere"):
    center = (
        voxel_widths[0] * (shape[0] // 2),
        voxel_widths[1] * (shape[1] // 2),
        voxel_widths[2] * (shape[2] // 2),
    )
    x, y, z = np.meshgrid(
        *[voxel_widths[i] * np.arange(0, shape[i]) for i in range(3)], indexing="ij"
    )
    if shape_type == "sphere":
        mask = (
            ((x - center[0]) ** 2 + (y - center[1]) ** 2 + (z - center[2]) ** 2)
            < (thickness / 2) ** 2
        ).astype(int)
    elif shape_type == "cylinder":
        mask = (
            ((x - center[0]) ** 2 + (y - center[1]) ** 2) < (thickness / 2) ** 2
        ).astype(int)
    elif shape_type == "plate":
        mask = (np.abs(x - center[0]) < thickness / 2).astype(int)
    else:
        raise ValueError(
            f"`shape_type` can be `sphere`, `cylinder`, `plate`; got {shape_type}"
        )
    return mask
Generate a synthetic sphere, cylinder, and plate:
shape = tuple([50] * 3)
voxel_widths = tuple([0.0607] * 3)
radius = 1

sphere = create_shape(shape, voxel_widths, radius, shape_type="sphere")
cylinder = create_shape(shape, voxel_widths, radius, shape_type="cylinder")
plate = create_shape(shape, voxel_widths, radius, shape_type="plate")
Step 3: Check their estimated mean thicknesses:
sphere_thickness_stats = calc_structure_thickness_statistics(sphere, voxel_widths, 0)
cylinder_thickness_stats = calc_structure_thickness_statistics(
    cylinder, voxel_widths, 0
)
plate_thickness_stats = calc_structure_thickness_statistics(plate, voxel_widths, 0)
print(
f"Sphere thickness is {sphere_thickness_stats[0]:0.3f} +/- {sphere_thickness_stats[1]:0.3f}"
)
print(
f"Cylinder thickness is {cylinder_thickness_stats[0]:0.3f} +/- {cylinder_thickness_stats[1]:0.3f}"
)
print(
f"Plate thickness is {plate_thickness_stats[0]:0.3f} +/- {plate_thickness_stats[1]:0.3f}"
)Sphere thickness is 0.898 +/- 0.000
Cylinder thickness is 0.929 +/- 0.000
Plate thickness is 1.032 +/- 0.000
This checks out because we set radius = 1 when we generated these shapes.
Now we can do a sweep over spheres, cylinders, and plates of various thicknesses to see how well we can estimate the thickness of these shapes at various resolutions.
shape = (100, 100, 100)
voxel_widths = (1, 1, 1)

true_thicknesses = np.arange(5, 50, 5)

est_sph_thicknesses = []
est_cyl_thicknesses = []
est_plt_thicknesses = []

for thickness in true_thicknesses:
    print(f"thickness: {thickness}")

    sphere = create_shape(shape, voxel_widths, thickness, shape_type="sphere")
    est_sph_thicknesses.append(
        calc_structure_thickness_statistics(sphere, voxel_widths, 0)[0]
    )

    cylinder = create_shape(shape, voxel_widths, thickness, shape_type="cylinder")
    est_cyl_thicknesses.append(
        calc_structure_thickness_statistics(cylinder, voxel_widths, 0)[0]
    )

    plate = create_shape(shape, voxel_widths, thickness, shape_type="plate")
    est_plt_thicknesses.append(
        calc_structure_thickness_statistics(plate, voxel_widths, 0)[0]
    )
thickness: 5
thickness: 10
thickness: 15
thickness: 20
thickness: 25
thickness: 30
thickness: 35
thickness: 40
thickness: 45
max_size = max(shape) // 2

fig, axs = plt.subplots(1, 3, figsize=(15, 5))

axs[0].plot(true_thicknesses, est_sph_thicknesses, "k-o")
axs[0].plot([0, max_size], [0, max_size], "r-")
axs[0].grid()

axs[0].set_xlabel("true sphere radius [vox]")
axs[0].set_ylabel("estimated sphere radius [vox]")

axs[1].plot(true_thicknesses, est_cyl_thicknesses, "k-o")
axs[1].plot([0, max_size], [0, max_size], "r-")
axs[1].grid()

axs[1].set_xlabel("true cylinder radius [vox]")
axs[1].set_ylabel("estimated cylinder radius [vox]")

axs[2].plot(true_thicknesses, est_plt_thicknesses, "k-o")
axs[2].plot([0, max_size], [0, max_size], "r-", linewidth=2)
axs[2].grid()

axs[2].set_xlabel("true plate thickness [vox]")
axs[2].set_ylabel("estimated plate thickness [vox]")

plt.show()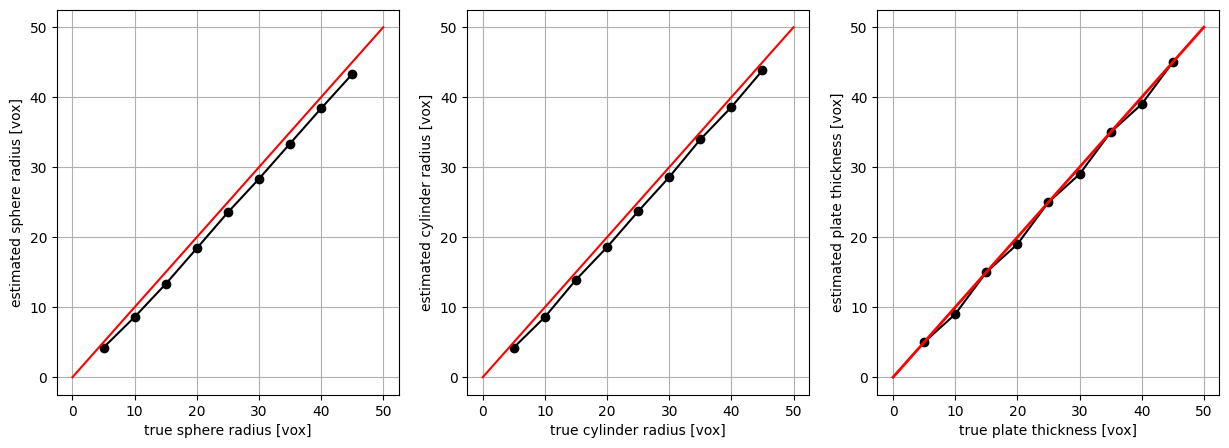
- Kuczynski, M. T., Neeteson, N. J., Stok, K. S., Burghardt, A. J., Hernandez, M. A. E., Vicory, J., Tse, J. J., Durongbhan, P., Bonaretti, S., Wong, A. K. O., Boyd, S. K., & Manske, S. L. (2024). ORMIR_XCT: A Python package for high resolution peripheral quantitative computed tomography image processing. Journal of Open Source Software, 9(97), 6084. 10.21105/joss.06084